Sample convergence plots
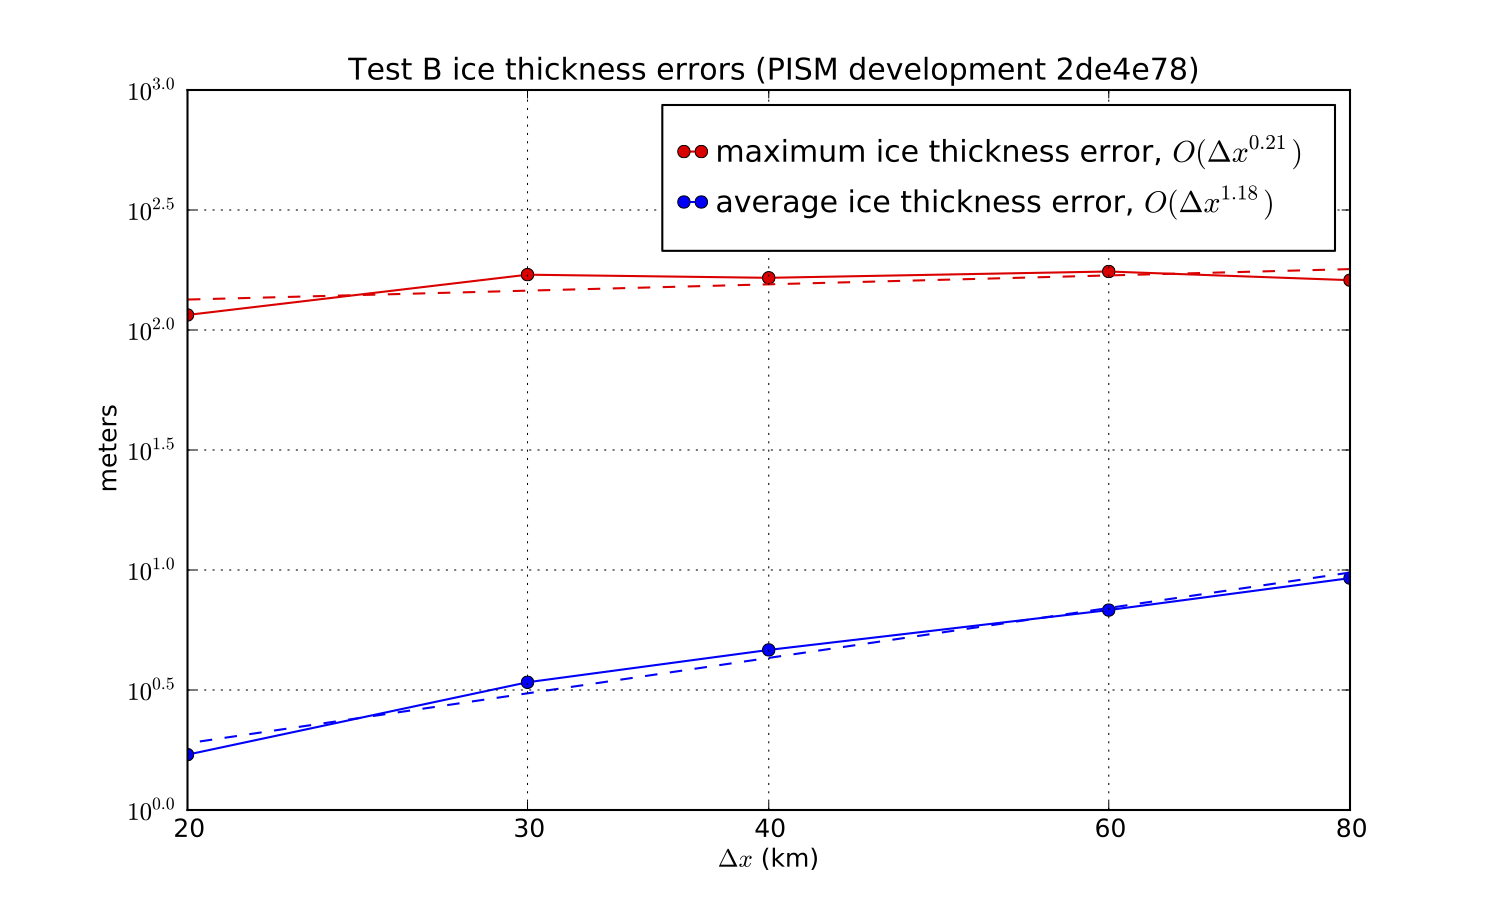
Fig. 35 Numerical thickness errors in test B. See [58] for discussion.
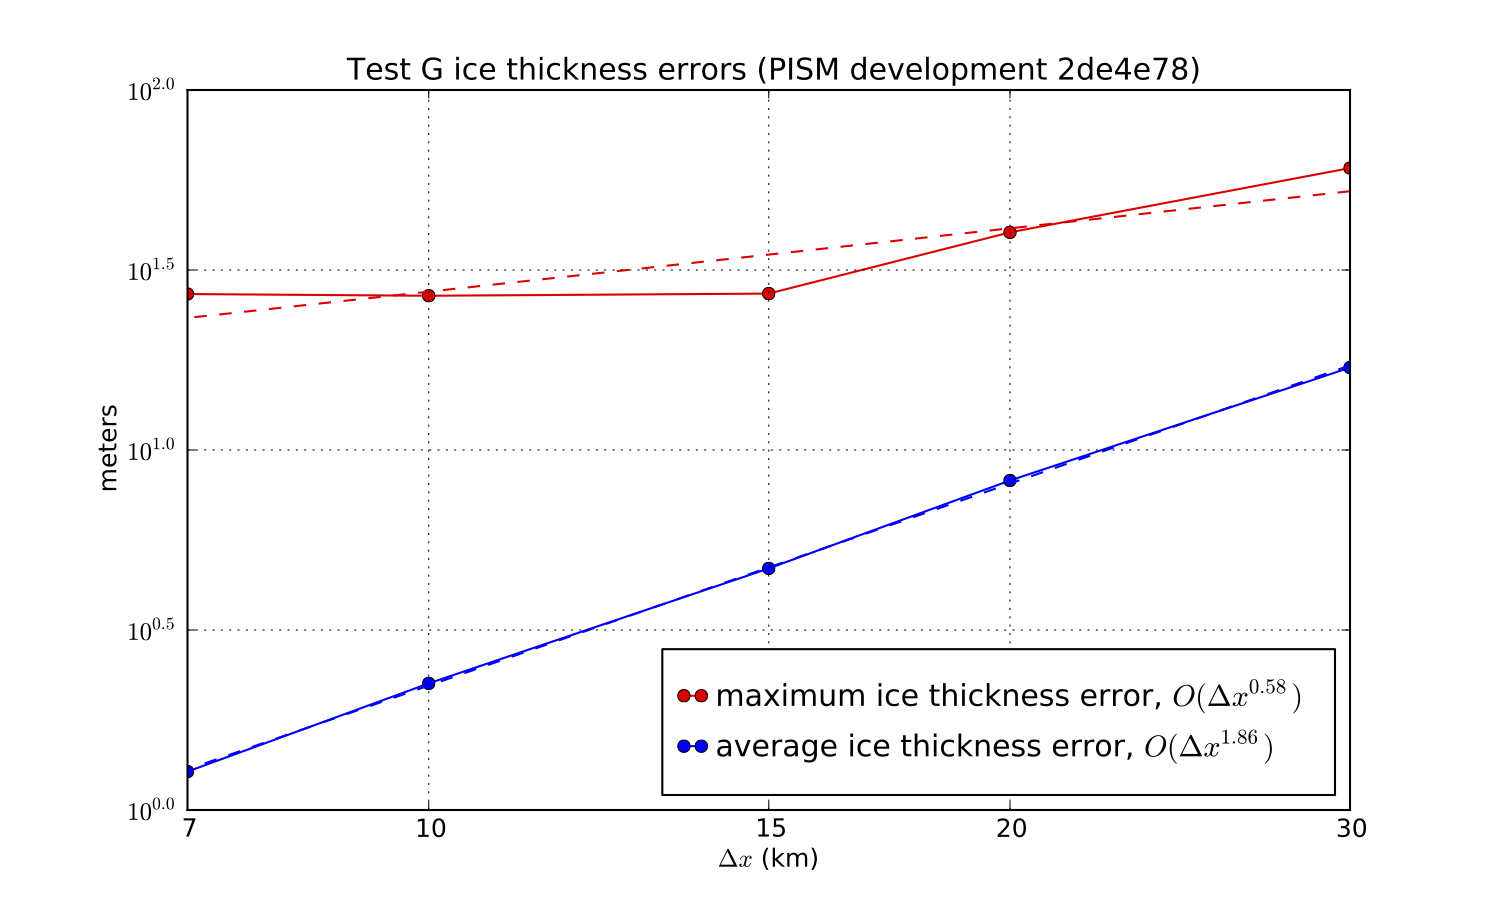
Fig. 36 Numerical thickness errors in test G. See [16] and [58].
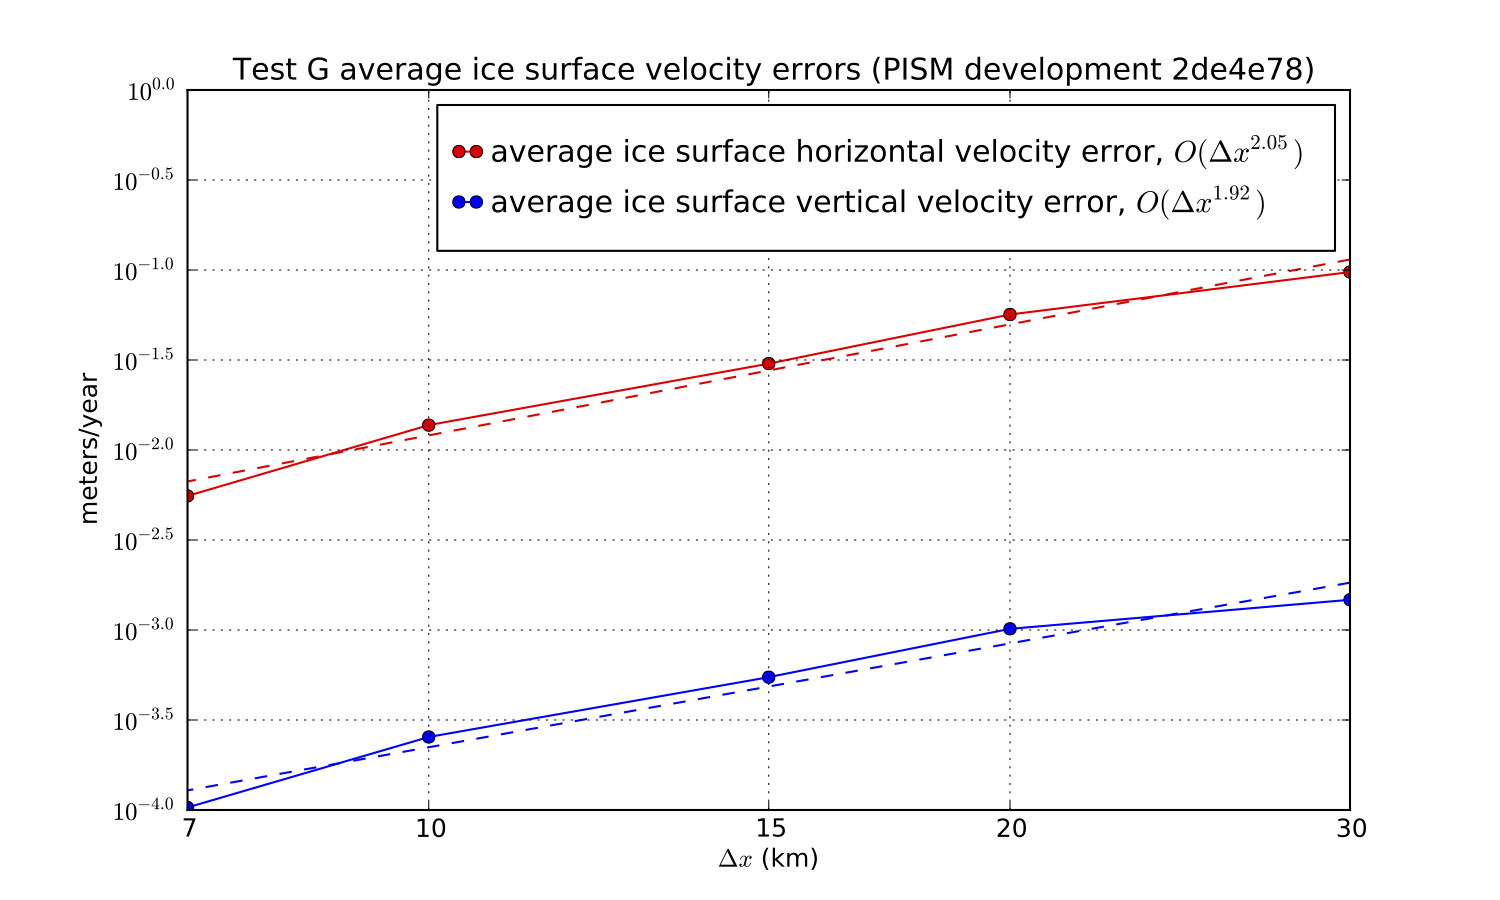
Fig. 38 Numerical errors in computed surface velocities in test G.
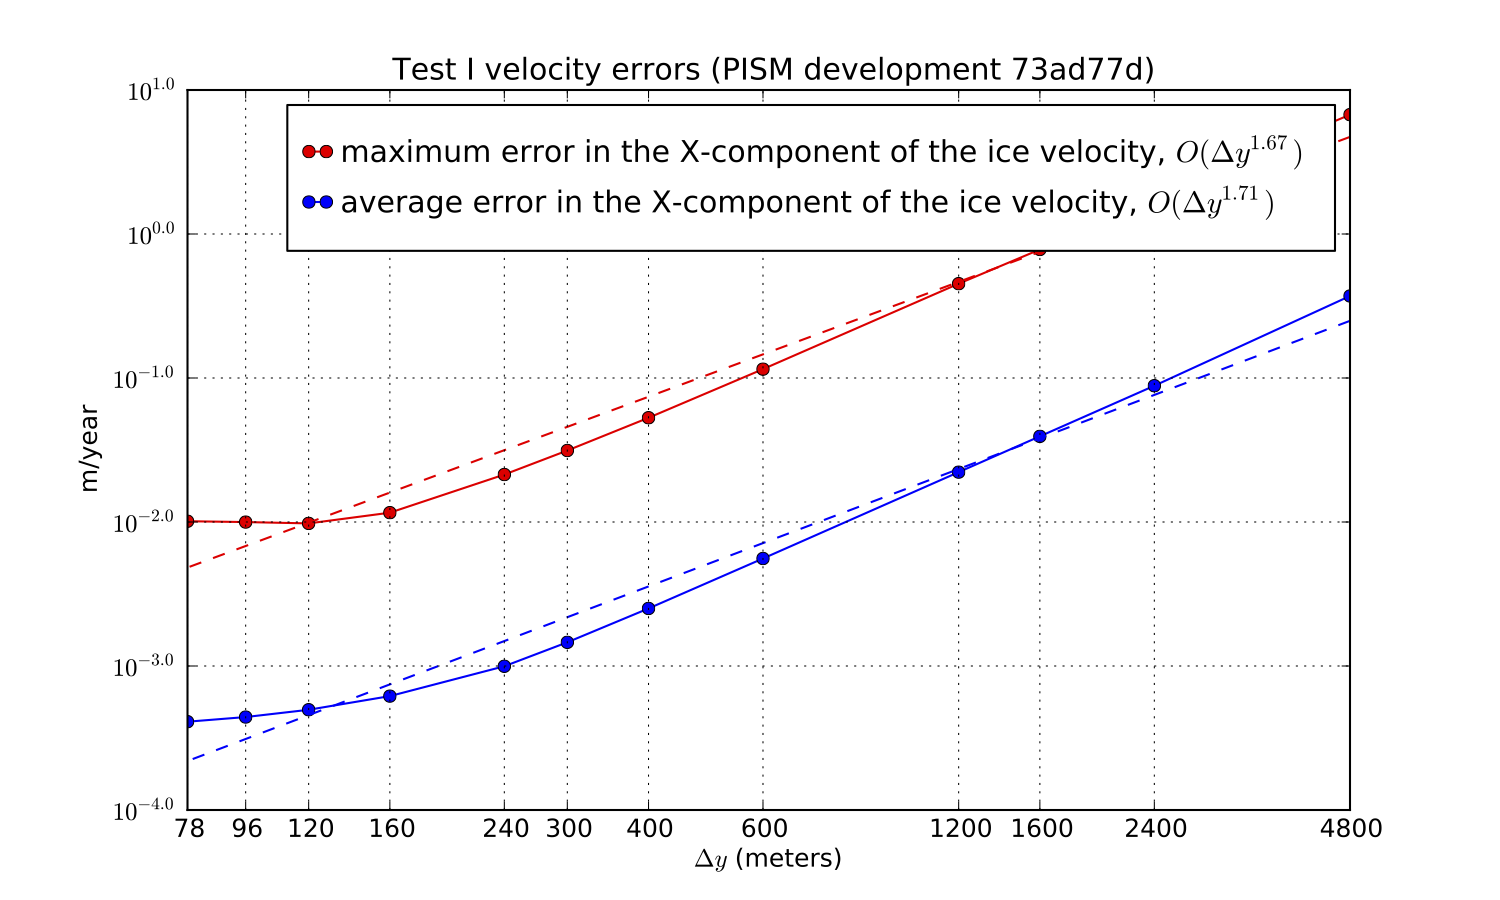
Fig. 39 Numerical errors in horizontal velocities in test I, an ice stream. See [21], [10].
| Previous | Up | Next |